In the last two parts of this series I explained some basic concepts first, and then we went over how we need to think, when we want to work with the available OHLC values.
This time we're finally going to do some work. Just as a recap:
I'd like to use moving average crosses as an example here. You could use more than two moving averages yourself, but in this example we're going to use only two. For the sake of simplicity these are going to be a 10-period Exponential Moving Average, and a 21-period EMA.
For a very basic strategy we need: entry, exit, and stop. It's possible to leave one or the other out by replacing it with a different mechanism, but that is an advanced topic. Let's stick with the basics. To make it even simpler, we're going to be trading longs only.
And so we have the following rules:
- Entry: if the EMA(10) crosses up above the EMA(21) we're going to be entering long.
- Exit: if the EMA(10) crosses below the EMA(21) we're going to be exiting.
- Stop: TBD.
For some people it makes more sense to use obvious swing points on the chart. For others they want to use an indicator, such as Bollinger or Keltner bands, a standard deviation calculation, etc. At the moment I'm experimenting more often using a band-based stop loss, because of a book I've been reading. For our current development we're going to be using swing points though, because ideally I want you to backtest this strategy manually. Why manually? Because then you have no excuse not to do it. You can do this kind of backtest all by yourself, for free, it only requires your effort. 😉
Entry and Exit
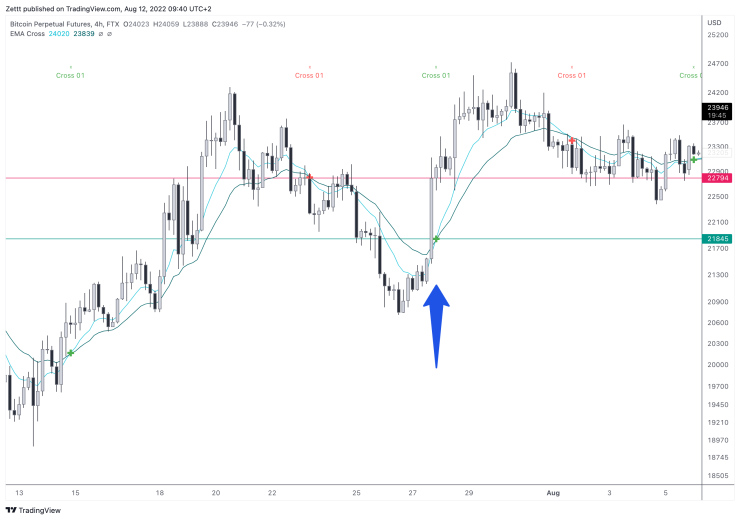
Let's look at a couple of examples, so you understand easier why the first two parts of this series were necessary to prepare you to do this now. As explained in pt. 2, we have to consider where the values of what we see are technically correct. That is, when does the cross occur? On this chart, marked with a blue arrow, is a bullish crossover. This would be our signal to enter long. What most beginners miss is that the actual price, where the crossover occurs, is not the same as the price where the two moving averages cross over.

As our entry rule suggests, we first need to wait until the two averages cross over. This means as long as the EMA(10) is below the EMA(21), there's nothing to do for us. We call this "confirmation". The cross is not confirmed, before it's actually printed on the chart, and cannot be changed anymore. Everything is open until the candle is closed. So the first price we can actually place our trade, is the opening price of the next candle. The opening price (we remember our OHLC values) of the confirmed bar is 22794; marked with a red line. The crossover price is marked with a green line, and is 21845.
This often misleads beginners, because they look at the chart, see where the cross occurs, and think that's the price they're going to get with the strategy. If price rallies strongly, and the averages cross, then that's not the case; as in this example.
Same goes for our exit, by the way. This was a profitable trade overall. The opening price of the red cross is just a tiny bit below the moving average. This should be clear to see now for you.
Stop Placement

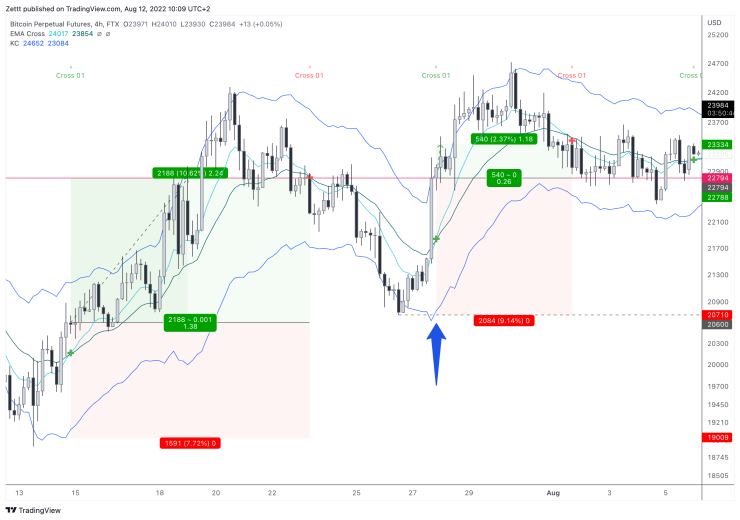
Our stop is the "obvious" swing low just before the trigger candle. The trigger candle is again marked with a blue arrow. The swing low is at 20710. Is this bad or good? You can decide for yourself. When I was new, I was told I need to have a "tight stop loss", because then when I would lose, I wouldn't lose as much. This isn't particularly true, as we will discover soon. Considering how often I read about it, and how hard I tried to make it work, that was just me being a total noob. Maybe it has to be like this. I can't save anyone from making mistakes.
You can enable the magnet function on TradingView to make the Long Position drawing snap to candle values. Very helpful.
For fun and giggles, I've also added a Kelter Channel as well to show how we would use it to set a stop loss. As you can see, it's not that different. Just keep in mind that when we place our stop, the current candle isn't closed yet, so we need to use the value of the parameter before our trigger candle, because it is fixed on the chart, to set a stop loss.
In this post we explored the difference of drawing and trading again. We also took our first virtual trade, and we learned how to set a stop loss. Come join me again next time where we're going to continue our strategy development.