Last time we decided what kind of strategy we're going to build. This time we're going to focus how we get in, and how we get out of a position.
I'd like to use moving average crosses as an example here. You could use more than two moving averages yourself, but in this example we're going to use only two. For the sake of simplicity these are going to be a 10-period Exponential Moving Average, and a 21-period EMA.
As I just mentioned most important part of a strategy are these three things:
- Entry
- Exit
- Stop
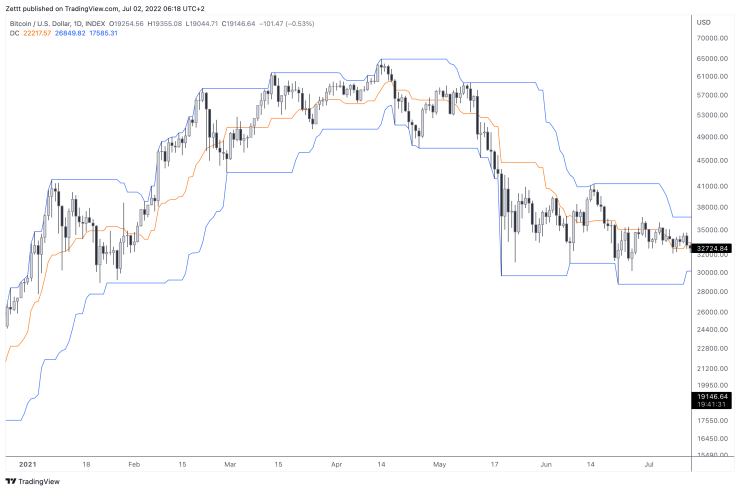
As a small detour we're going to look at how we would enter using a Donchian channel breakout. A breakout in that sense would be a close above the Donchian channel. Looking at how a Donchian channel is defined, however, we can see there's a problem with our rule. Let me explain. A Donchian channel measures the highest highs and the lowest lows over a certain period.

So if we want to enter a long, for example, on a break of the highest high, the closing price would have to be higher than the highest high. By definition this would mean that the current close would have to be higher than the high value of the current bar. This is a common problem you're going to be facing developing your own strategies--either on paper or in code. Certain parameters seem to make sense talking about them, but are practically impossible to realize. In this example it's better to compare the current close with the highest high 1 period before.
if close > high[1] then enter long
// or in pseudo code
if the current close is bigger than the high value one period ago, then enter long
If this doesn't make sense, please make sure you understand how bar charts form. Every candle/bar has 5 values: open, high, low, close, and volume. That's why the bar charts are often referred to as OHLC, which is something you're going to find often when writing your own code. The way the Donchian channel is drawn is it's looking at the absolute highest high value, and the absolute lowest low value over a certain period. In this case 20 candles (simplified example):
lower = ta.lowest(20)
upper = ta.highest(20)
plot(upper, "Upper", color=#2962FF)
plot(lower, "Lower", color=#2962FF)
In Python you'd use the min() and max() functions.
Going back to moving averages the usual way many would like to enter/exit is when the fast moving average crosses the slower one up or down. Therefore we can write something like this as an entry criteria:
if ema(10) > ema(21) then enter long
if ema(10) < ema(21) then enter short
Let's again look at how the indicator is calculated first, before we use it. A moving average is formed by calculating the average of the last closing prices over a certain period--10 and 21 in our case. You can do this by yourself in a spreadsheet. I can highly recommend doing this exercise just once in your life! On TradingView look up the last 10 closes and write them down in your spreadsheet then use the AVERAGE() function to calculate the (simple) average of your closing prices. To calculate an exponential average, you have to do a little bit more math. You get the point though, we calculate a new value using our OHLC candles.
In this part of our strategy building we learned how what we see on the chart might not be useful for creating a strategy, and we need to question what we do every step along the way to arrive at a result that is: primarily technically correct, and only secondly "profitable". We also learned how some indicators are drawn on your screen. This knowledge can help you figure out how any other indicator is being drawn, or calculated.